Reading the Aurora: What Transformer Attention Sees in Auroral Spectra

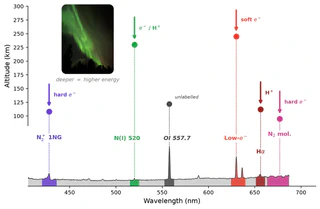
Auroras are the visible trace of energetic particles precipitating into the upper atmosphere. The energy of these particles sets how deep they penetrate, and therefore which emission lines they produce: soft electrons stay high and glow red (OI 630 nm), harder electrons go deeper and light up the green OI 557.7 nm line and the violet N₂⁺ band at 427.8 nm, while protons leave their signature in Hα. A spectrum is thus a fingerprint of what is raining down on the atmosphere, and classifying it still relies on expert visual inspection, which does not scale.
In a paper with Gaël Cessateur (Royal Belgian Institute for Space Aeronomy) and Sébastien Lefèvre (IRISA), presented at RFIAP 2026 in Montpellier, we introduce the multi-label classification of auroral emission spectra as a novel task: 719 spectra from the ASIS spectrograph in Skibotn, Norway, each annotated by experts with five binary labels. And we ask a simple question: can Transformer attention double as a physical interpretability mechanism?
A tiny ViT for 1D spectra
A 1D spectrum is just a single-row image. We split each 1024-bin spectrum into 8 patches and feed them to a small Vision Transformer (ViT-1D), compared against an MLP baseline built from the same backbone with a single full-spectrum patch, so that any interpretability gain must come from patch-level attention.
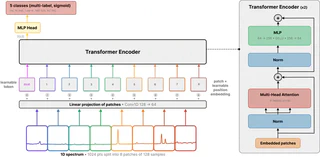
Both models classify well (macro average precision: 81.1% for the MLP, 77.8% for the ViT-1D), and the ViT-1D wins precisely on the hardest, most diffuse class, the molecular N₂ bands.
Attention rediscovers the emission lines
The real result is elsewhere. For each class, we compare the attention of positive versus negative samples along the wavelength axis. The resulting maps align with known spectroscopy: N₂⁺ attention peaks exactly on its 427.8 nm band head, Hα attention rises toward 656 nm, and the low-energy-electron class attends to the red oxygen region above 630 nm. The model was never told where these lines are; supervision came from the labels alone.
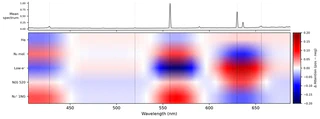
Not every class is read from its own line, though. Molecular N₂ is recognised through co-occurring emissions at 427.8 and 557.7 nm, consistent with the co-production of these nitrogen species by energetic particle impact on N₂, and the unlabelled 557.7 nm line is attended by both N₂ mol. and N₂⁺ 1NG, a co-excitation recovered without supervision. N(I) 520 is the intriguing case: the model reads it from the co-occurring red oxygen doublet at 630/636 nm, while its own 520.0 nm line is never attended, an open question for further study.
Attention maps thus act as a built-in attribution mechanism on ordered 1D scientific signals, something the MLP simply cannot offer, and a promising basis for self-supervised spectral categorisation.
Try it yourself
The published model now runs in your browser. The Aurora Spectra Classifier takes a spectrum you upload (or one of the built-in examples), runs the full 15-model ViT-1D ensemble, and returns the per-class probabilities alongside the attention map drawn over your own spectrum, so you can watch where the model looks. The preprocessing is identical to training, and any out-of-domain input is flagged rather than silently classified.
To go further: the paper, the interactive demo, the poster presented at RFIAP 2026, and the publication page.
